![]()
|
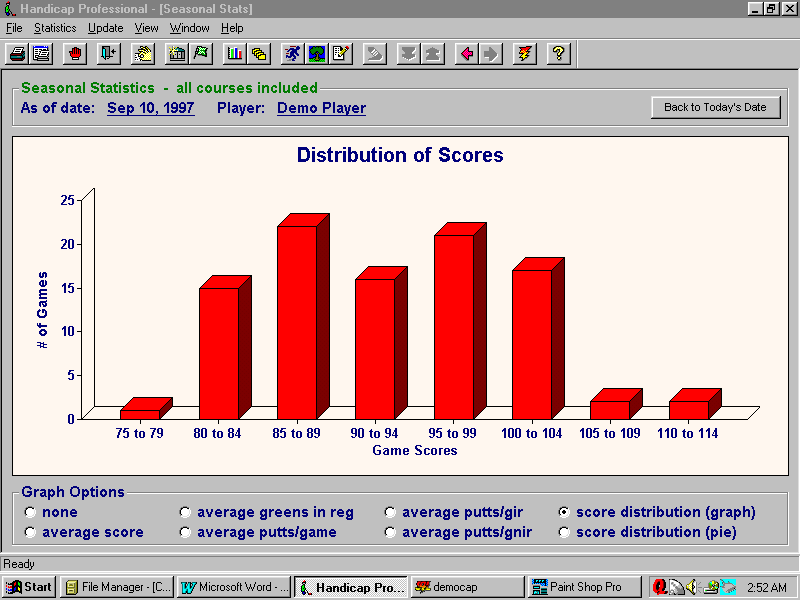
Screen Shot - Score Distribution Bar Chart |
|
This screen graphically illustrates your scoring breakdown. It
constructs a bar in the graph at each multiple of 5 strokes based on your
range of scores. You can view this graph for all scores or just scores for a specific season. Using course filters you can also graph data for a single course only. |

![]()
Home Overview
Features Screen Shots Downloads
Purchasing FAQ's System Requirements Technical
Support Contact Us
![]()
