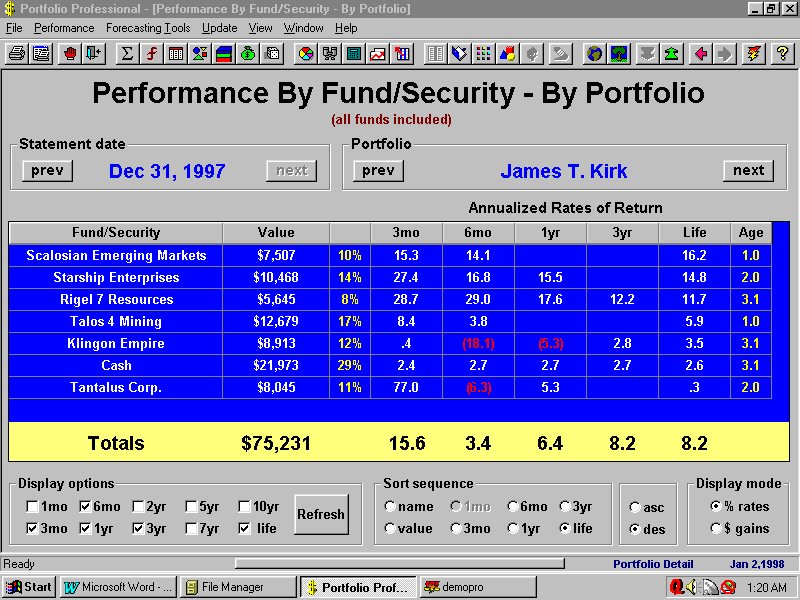
| Screen Shot - Performance results displayed in a matrix |
| This screen is an example of how a great deal of performance data can be presented at the same time in a single display. In this example, each row is a security held in an individual portfolio. The columns contain the calculated rate of return for the specified time periods dating back from the current date.
Up to 10 time intervals can be selected for display, although in this example, only the 3 month, 6 month, 1 year, 3 year and lifetime rates are selected. The sort sequence is optional, in this case the investments are ranked in order of their lifetime return rates. The Display mode option allows you to toggle the values in the matrix from return rates to dollar gains and back again. |