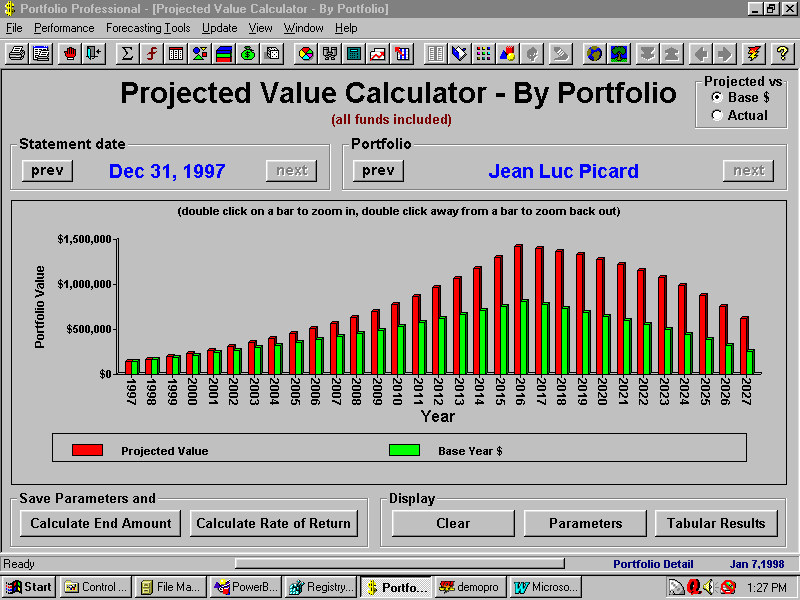

| Screen Shot - Graphical projected value |
| Results from the projected value calculator can be displayed graphically as seen below. You can calculate the end amount from the rate of return or calculate the rate from a specified end amount.
Target scenarios can be saved for each individual portfolio. Your actual performance can be graphed relative to the target scenario. In this case, future value is graphed against the base year equivalent of the future value. |


